
In the face of the Health Secretary’s ‘war on overspending‘ healthcare analytics and health economics can show where redistribution of budget can make huge impacts on systems under pressure. But are facts and figures enough to help people working at the highest alert levels make room for new ideas in their day? Senior Communications Manager Tom Parnell takes a look at how we turn charts into change.
Delivered with a K.I.S.S.
My mother-in-law is on the phone to an NHS nurse. She’s thanking him for his help but telling him it’s ‘not the right time’ for her to quit smoking. This is a lie.
My mother-in-law has COPD, the complex system that is made up by her respiratory organs is failing under the pressure of having to regularly deal with an intake of tar and other noxious chemicals.
The NHS knows the solution to this problem – my mother-in-law needs to quit smoking. There’s reams of scientific evidence to back up this conclusion. Years of studies, papers and carefully analysed data all point to quitting smoking leading to improvements for COPD and even reducing risk of death, it’s even written on the side of cigarette packets.
My mother-in-law wanted to quit, she went to her GP for help, and was given all the NHS’s tools which they use to support patients in this extremely difficult venture. These included reams of leaflets and information to read, instructions on keeping a no-smoking diary, setting up alerts for applying nicotine patches and various other measures that the quitter is supposed to take.
The result? My mother-in-law felt overwhelmed. The ‘help pack’ ended up adding a considerable amount of stress onto what is widely recognised as an already highly stressful activity to undertake, and so she gave up giving up.
So what happened here? We know the science is good. Those quitting methods, keeping a diary, setting timers, etc. have almost certainly been successfully tested on other patients. But the NHS gave her everything at once and told her it was all equally as important. This brings us to lesson 1: K.I.S.S. – Keep It Simple Stupid!
In case you haven’t already guessed the subtle analogy I’ve been building up to, we at the Health Economics are experts at finding evidence-based impactful changes in complex system. Our work using allocative efficiency to analyse COPD pathways for ICSs and ICBs found numerous potential improvements which could improve population health while not adding to the system’s budgets.
We worked with huge data sets, as well as swathes of information gathered from patients, clinicians and other stakeholders, all put through the kind of algorithms that Hollywood films put on chalk boards to demonstrate that the film’s hero is taking a maths class for super geniuses.
We could have just handed all our workings out over in a huge document, said “it’s all in there”, collected our cheque and gone home. We would have given the system leaders all the information they needed, they just would have to have read several thousand words to find and understand it, and ultimately nothing more would have happened.
Instead, because we had already engaged with stakeholders across the ICSs and ICBs we were able to give them the recommendations they needed, in a format they could use. Clear and simple changes they could make in budget allocation and commissioning of services, to potentially keep hundreds of patients out of hospital for longer, saving millions of pounds further down the line. While it’s important to have the ‘why’, and we always show our workings, some people just need to know the ‘what’ so they can take the next steps to improvement.
If in doubt, trust yourself. I’m no analyst, I’m a communications professional, so when it comes to complex data I consider myself the ‘stupid’ in the K.I.S.S. acronym, and my rule is “if I can’t understand what we’re recommending, then other people won’t.”
More than just a number
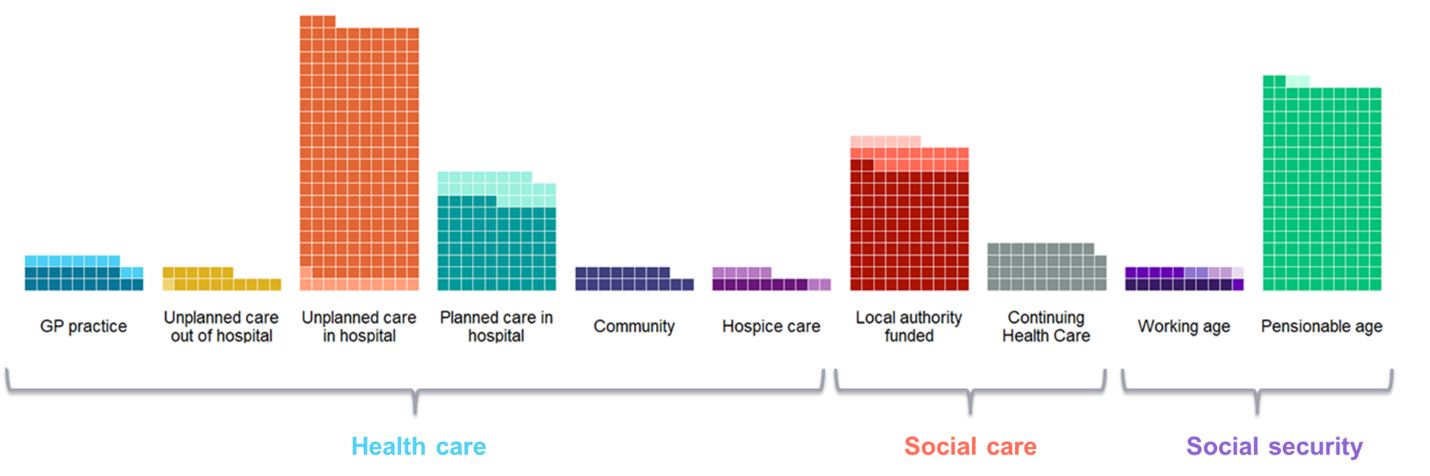
Change is driven not only by evidence, but also by passion. Our work for Marie Curie UK, in collaboration with the Nuffield Trust, showed that at least £22.1 billion is spent on end of life care every year in the UK, with 81% of health spend spent in hospitals.
Your average person, upon hearing this figure, might think little more than “Huh, that’s interesting.” but by understanding the story behind the data – the numbers of people dying in hospital, who would rather be dying at home and the cost and pressure this also puts on the NHS – and combining it with Marie Curie’s passion to improve end-of-life care in the UK, we are able to drive significant change.
Soon after its publication, our work was driving debate on Radio 4’s Today programme and BBC 5 Live’s breakfast show, and making headlines in the Independent, the Mail, the Mirror, the Standard, the Express and the Guardian, as well as the BMJ and The Carer.
Most impactful of all, Lisa Cummins, of the HEU, joined representatives from Marie Curie and the Nuffield Trust at a parliamentary roundtable, where our evidence was shared and MPs were briefed on how this should feed into the NHS’s 10 Year Plan to improve care for the dying.
Our analysts are great at understanding healthcare data and pulling insights from it, but sometimes we need to take a moment to think about the lives which our statistics cover and the stories which the numbers contain.
Thanks to analytics, we continue to discover more ways in which we can collaborate to improve population health, but it is only through effective and passionate communication that we can turn these ideas into action.
Want us to help you find and communicate impactful solutions? Contact us today.