
Population health management is a core principle of our work at the Health Economics Unit (HEU) and we are proud to be able to collaborate with and support innovators at the cutting edge of this practice. We invited Andrew Holden, Business Intelligence (BI) Lead Population Health Management and Metric Developer, NHS Midlands & Lancashire Commissioning Support Unit (CSU), to write this post explaining how the BI team supports health systems across the country to get the most from their data.
The CSU called its health and care intelligence portal Aristotle to reflect the name’s etymology of ‘the best purpose’. Our aim with Aristotle is to put data to its best purpose by presenting it for leaders across health and care in ways that allow the greatest utility and benefit, transforming data into actionable insights.
We use Aristotle to work with partners on a range of projects, most recently to support population health management (PHM), tailoring the system to suit local needs. We work by first seeing what data we can bring together – we can build the tool on top of shared care records where available, for example – and how we can best display it considering the needs of the various end users. We originally thought there would be a focus on requests from integrated care systems (ICSs) but very soon primary care networks (PCNs) were also showing an interest, as the users ‘doing the do’ of care delivery.
HEU Director Andi Orlowski said: “It’s great that Aristotle offers world-leading approaches all in one box, and the analytics capability and capacity it provides make it easier for people to do population health analytics.”
Online tools and reports
Aristotle’s suite of tools and reports allows users in different parts of the system to choose the kind of information they want to see. For example, the commissioning reporting suite allows commissioners to look at areas such as pathway redesign; the primary care reporting suite offers GP practice-level tools for risk stratification and patient profiling (see figure 1); and the specialist analyst toolset contains the detailed data behind the reports. This means BI analysts can further query the data, carry out deep dive analyses and build their own bespoke reports.
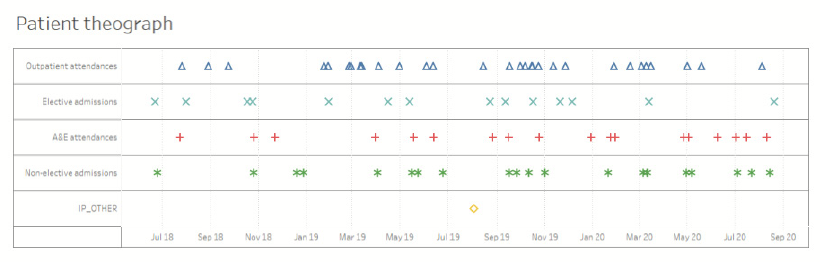
Figure 1: At primary care level, person identifiable data is available to the GP and their staff along with patient theographs (a visual representation of activity over a period of time) illustrating secondary care use patterns.
Personalised viewing
Thanks to this ‘modular’ element of its design, the output from Aristotle can be delivered in different versions for varying audiences.
For example, clinicians can see the NHS number and patient information ‘in clear’ (patient identifiable), but ICS and local authority colleagues receive a pseudonymised version that protects confidentiality. However, they are all working from the same data, seeing it through their own lens with controlled access rights, as agreed with our contracts. Colleagues working in organisations that are not on the Health and Social Care Network (HSCN) (for example the police or voluntary, community and faith sector) can also access Aristotle Xi, allowing true partnership working, a fundamental component of successful population health management.
Supporting population health management
The segmentation tool within Aristotle is called the PHM Covid Risk Segmentation Tool (figure 2). We are currently able to include data from the national shielded list and those with high risk factors for COVID-19, for example age or pre-existing respiratory conditions, but this may change in the future subject to data availability. The report is continually being developed in response to changes in data availability, user requirements and technical capabilities of the software used to build the tool.
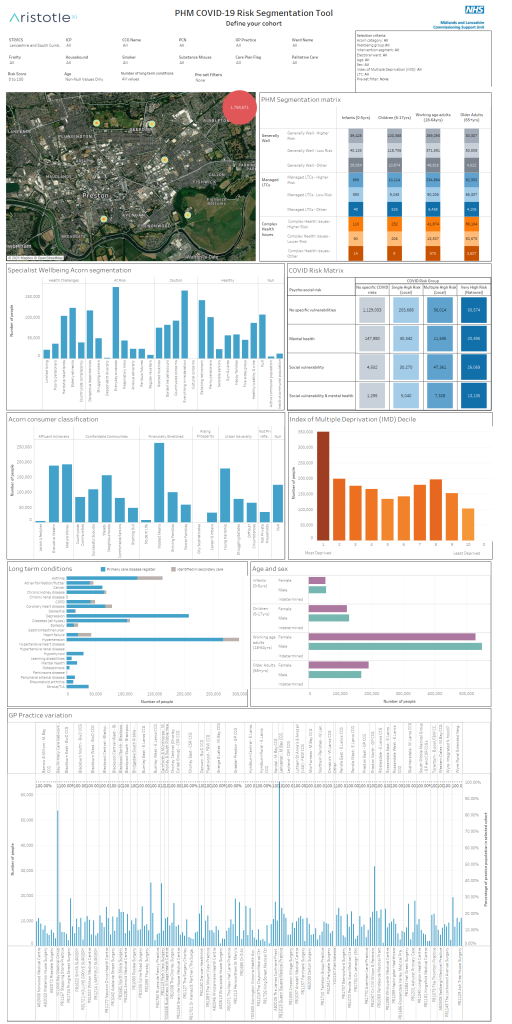
Figure 2: PHM Covid Risk Segmentation Tool
The tool includes a mapping function (figure 3) to encourage a place-based approach to population health management, allowing users to see the distribution of the population rather than just looking at information by organisation, and to better understand the impact of their particular geography. This allows factors such as different environments, risk of social isolation, crime, self-assessment of happiness etc. to be added into the data, specific to a system’s patch.
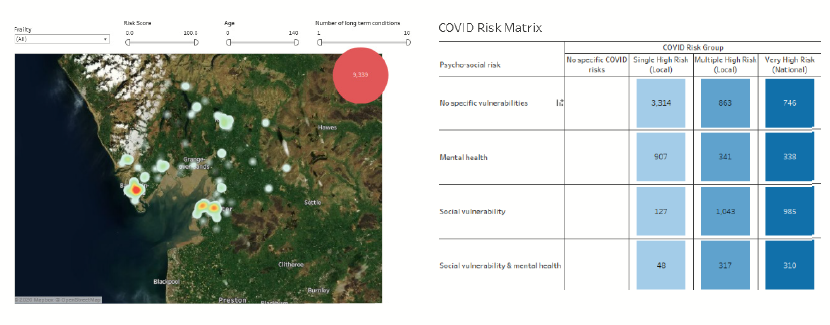
Figure 3: Using the interactive map tools, cohorts can be further segmented by geography by identifying the exact number of people in a neighbourhood and matching that with the chosen criteria
Regional support
We have been working with a range of ICS areas to support their PHM work. A few examples can be seen in the work we have supported in Lancashire and South Cumbria ICS, and in Leicester, Leicestershire and Rutland ICS. The key is that while the tool can make a list of patients or areas based on a range of criteria or data fields, what happens next is most important, so our support doesn’t end with the data.
Within Lancashire we worked on a project with Morecambe Bay CCG in a PCN-based project coordinated by a public health registrar. We helped them to identify specific patient cohorts, for clinical leads to then provide an intervention and evaluate its success. For example, some used the tool to look at the rural elderly population, using mapping and Acorn segmentation to look at their risk of social isolation; others looked at young people just starting to take responsibility for their own health; another targeted cervical screening focusing on women in the relevant age groups; and others looked specifically at neighbourhoods with multiple complex needs.
A successful winter wellness project was also developed for people with four or more long term conditions, so that practices could identify appropriate patients and bring them in to offer support.
In Warrington, we incorporated their Rockwood clinical frailty scale data into the segmentation tool and used mapping to support decision-making on where to locate a new frailty service.
Leicester, Leicestershire and Rutland ICS use the Johns Hopkins ACG risk stratification model, so a bespoke PHM segmentation tool was built to maximise the available data within the ACG model.
Sharing learning and tailoring support
It’s crucial for PHM that all stakeholders work together to tackle issues as a group. By providing insights for clinicians and leaders at all levels across health and care systems, we can help them develop tools such as health inequalities reports, to find the people where they can make the biggest impact. We also share learning across ICS areas, including examples of interventions that have been successful and an idea of how they might work in other populations.
By working together with systems across the country, we hope to present timely, actionable intelligence that is specific and relevant to each place. This will support leaders and clinicians to gain a deeper understanding of service use and any inequalities, to support the transformation of their health services.
Access to the Aristotle tool can be requested via MLCSU.aristotlesupport@nhs.net. For more information go to www.academy.midlandsandlancashirecsu.nhs.uk/business-intelligence/aristotle-xi/. Full training and support are available via the MLCSU Training and BI Product Delivery teams (mlcsu.bi-productdeliveryteam@nhs.net) as well as CSU BI staff embedded in CCGs.