
In the summer the Health Economic Unit’s expert senior econometrician Bruno Petrungaro had the opportunity to speak to participants of the Midlands Decision Support Network’s quasi-experimental approaches ALS about Directed Acyclic Graphs (DAGs) and how they can be used to help us better estimate causal effects. Here Bruno runs through the basics of what DAGs are and how we can use them when conducting health research.
What are Directed Acyclic Graphs?
DAGs are a brilliant graphical tool that can really help us to visually represent and better understand some key concepts in healthcare research, such as causation, confounding, and bias.
Essentially, they are a model of how we think the world works which allows us to show the causal relationships between different variables.
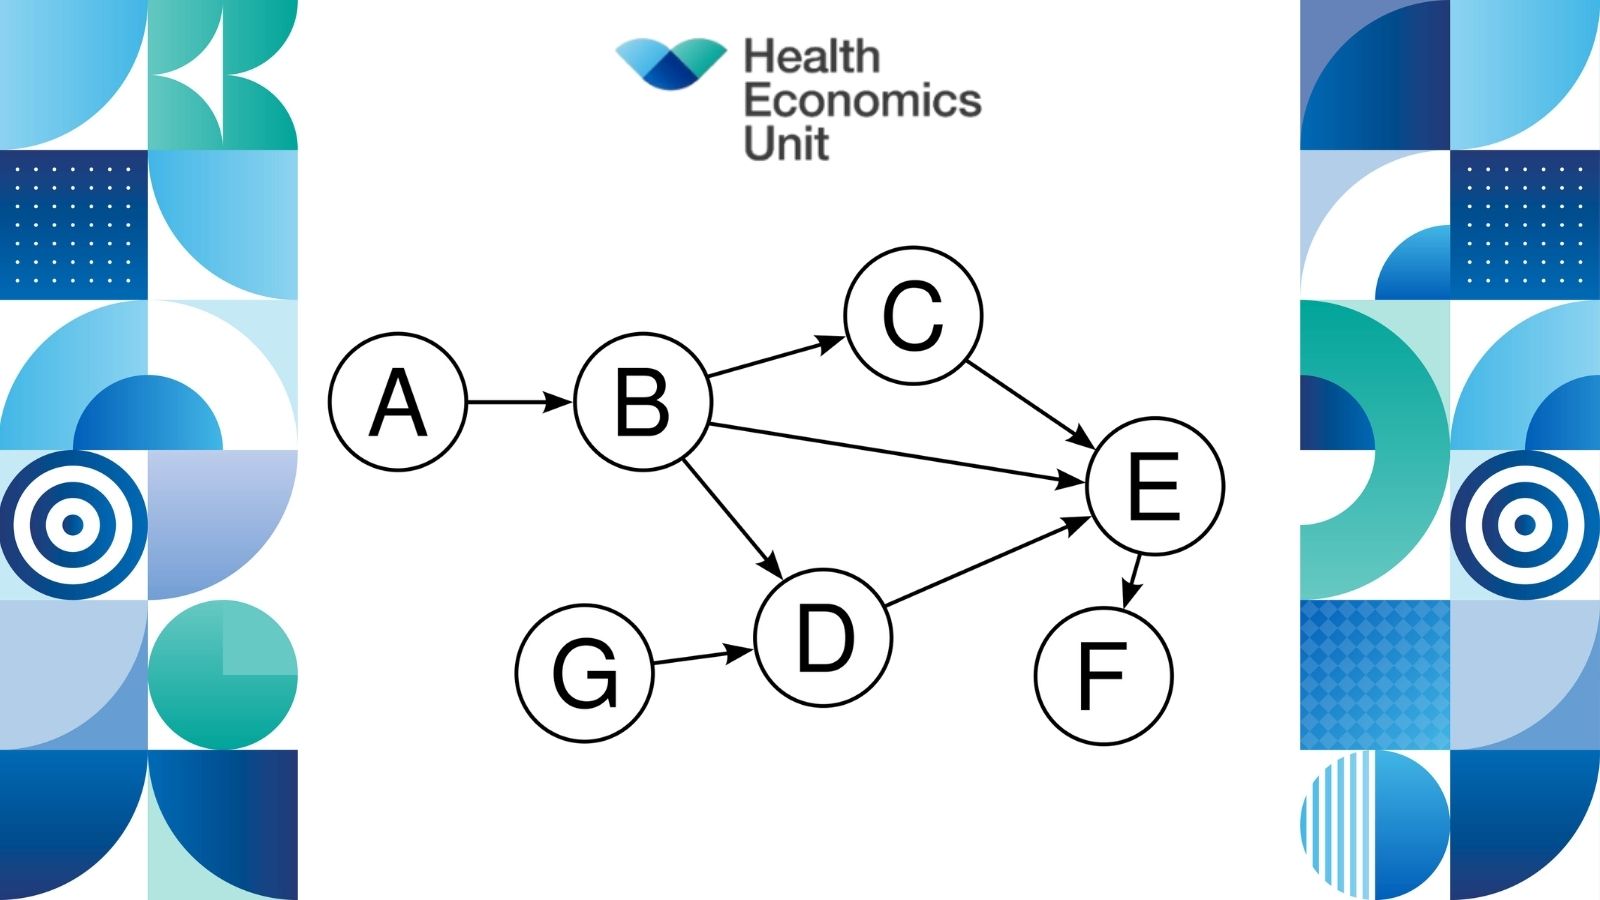
A graph typically consists of a set of vertices and a set of edges – vertices represent the variables and edges represent the connections between them. Edges can be either directed or undirected. A directed path is a sequence of edges connecting two or more vertices in a particular direction. A cycle would only happen if there was a directed path from one vertex all the way back to itself. A graph containing no cycles is called acyclic.
Simpson’s paradox
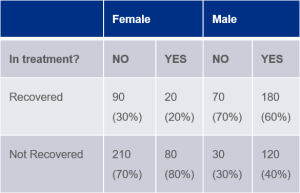
Let’s try putting this into an example. Say there is a new treatment being tested on a group of 400 men and 400 women[1]. Half of the cohort are in the treatment group, half are in the control group, and they are assigned to either group at random. Results show that 50% of those in treatment recovered compared to 40% in the control group. Does this mean the treatment has a positive effect? Not necessarily…
In this case, if you look at the data from a different viewpoint and consider the sex of the participants, you’ll see that, for both men and women, the recovery rate is better without the drug.
How can DAGs help?
This is known as Simpson’s paradox, which happens when groups of data show one particular trend, but when the data is broken down into finer groups the trend is reversed. To solve this, we need to consider all the causal relationships.
In the example above, a DAG would look something like this:
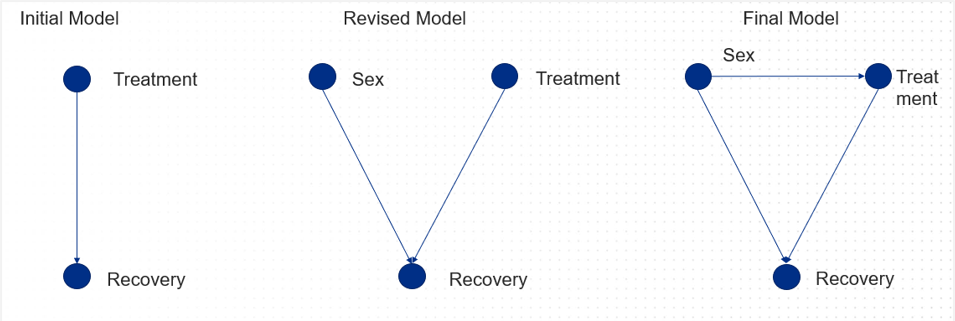
By using information we already have on causal relationships, DAGs can be really valuable in helping us to predict the results of an intervention and assess its potential value. Of course, we always have the option of setting up a randomised control trial, but sometimes it can be unfeasible due to ethical concerns, or because it’s just too expensive.
How can I build a DAG?
There are three approaches you can take to building a DAG:
1. Knowledge based: the structure of the model is determined from knowledge
In this approach, clinicians may use their own knowledge and expertise (and perhaps that from other sources, such as literature reviews) to build a graph which shows cause and effect for something they understand well, for example the relationship between smoking and lung cancer.
2. Data driven: the structure of the model is automatically learned from available data
Here we would look to run an algorithm on a specific data set and determine the relations from the data alone. This might be used in cases where access to existing knowledge is difficult to obtain.
3. Information fusion: combining approach one and two
Finally, in this case we are considering expert knowledge and data, so we may use an algorithm but give it some extra information that we already know about the causes and effects we’re trying to understand more about.
Summary
In summary, DAGs are a really important tool in helping us to estimate the impact of a particular intervention by combining existing knowledge and data-driven approaches. They can help us to make interventions better and more successful for patients and our systems. This is really just a brief introduction, so if you would like more information about how to build and apply DAGs, how they can help solve issues with confounding and more, please get in contact with our team.
[1] Example taken from Risk Assessment and Decision Analysis with Bayesian Networks, Norman Fenton and Martin Neil, CRC Press 2019